Google reviews
need constant care
to bring in new customers.
ReviewTactic is an AI-powered Google review manager platform where you always stay in control.
- Pro replies in minutes
- Better Google Search rankings
- Appeals unfair 1★ reviews
- Competitor & customer analysis
5 replies/month free · No commitment
The food was great, but on Friday night we had to wait way too long. An hour and a half for the main course is a bit much... The waiter at our table was friendly though.
of customers check your reviews before visiting.
of customers prefer places that respond to every review.
is the ideal response time before Google reduces your visibility.
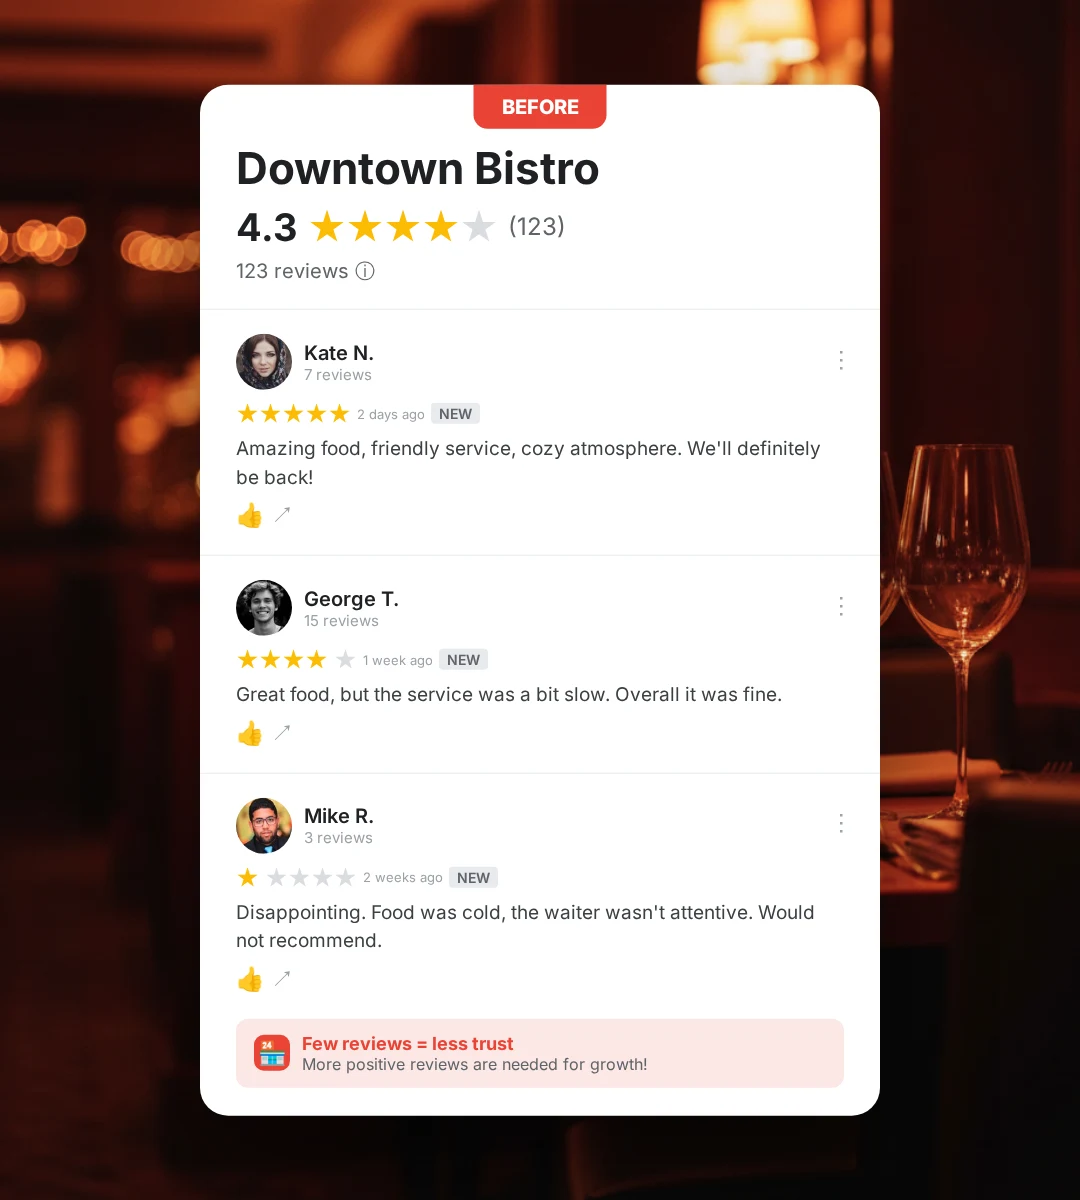
Your Google reviews
are working against you right now
Unanswered reviews send customers to your competitors. Google notices too — no replies means lower rankings. You care. You just don't have the time.
Every review answered. Every pattern caught.
Nothing slips through anymore.
Continuous monitoring
ReviewTactic monitors your Google Business Profile around the clock. New review? It picks it up instantly and starts processing. Average response time: under 3 minutes.
Replies in your voice
Not templates. Personalized replies that match your tone. With relevant SEO keywords, in automatic or approval mode.
Handles criticism calmly
Negative reviews aren’t enemies — they’re opportunities. ReviewTactic responds empathetically and builds trust with future customers.
Fake reviews too
Identifies suspicious reviews (competitors, irrelevant, ex-employees) and drafts appeals following Google’s guidelines.
Business X-ray of your
restaurant
ReviewTactic doesn’t just manage reviews. It reads between the lines to show what’s really happening at your place.
Customer profile
Who are your customers? Where do they come from? What do they like and dislike? ReviewTactic extracts it from your reviews.
Competitors
ReviewTactic also analyzes reviews of nearby competitors. It shows you their weak spots.
Action items
Not generic advice — specific, prioritized to-do lists based on review patterns.
The AI doesn't just reply. It gives you actionable recommendations.
Customer feedback becomes concrete action items that drive real results.
Full control. Full autopilot.
Everything in between.
Some weeks you want to approve every reply. Other weeks you just want it handled. Move between four modes whenever your trust level, or your schedule, changes.
Live in under 10 minutes.
Link your Google Business Profile in one click. We only access your reviews, nothing else.
Set your tone, pick your mode, and let ReviewTactic process your backlog. Five draft replies land instantly so you can see the voice match before anything goes live.
New reviews get drafted in real time. Approve, edit, or let autopilot handle it, depending on the mode you chose.
Sentiment trends, response gaps, rating shifts, and competitor benchmarks, all in one dashboard.
Your first 5 replies are on us. Every month.
No contract. Other tools charge $300–500/month.
- Then pay per reply. Typically $8–25/month.
- Dashboard, analytics, competitor tracking included
- No monthly fee, no contract
- Disconnect Google anytime — billing stops instantly
No commitment. Cancel anytime.
A few more things
people often ask.
For negative reviews (1–3★), a draft is always created for your approval. Positive reviews (4–5★) are automatic by default, but you can turn that off in settings.
Only reviews and replies. We don’t read your email, personal data, financials, or any other GBP data.
Yes. Disconnect Google in settings and billing stops immediately. No cancellation fee, no retention calls.
Every negative reply goes through your approval. 15+ settings for tone, length, and complaint handling. If it’s not right, regenerate or edit manually.
Yes. ReviewTactic is fully compliant with Google’s review policies. It does not incentivize reviews, does not practice review gating, and a 100% response rate is a positive local SEO signal.